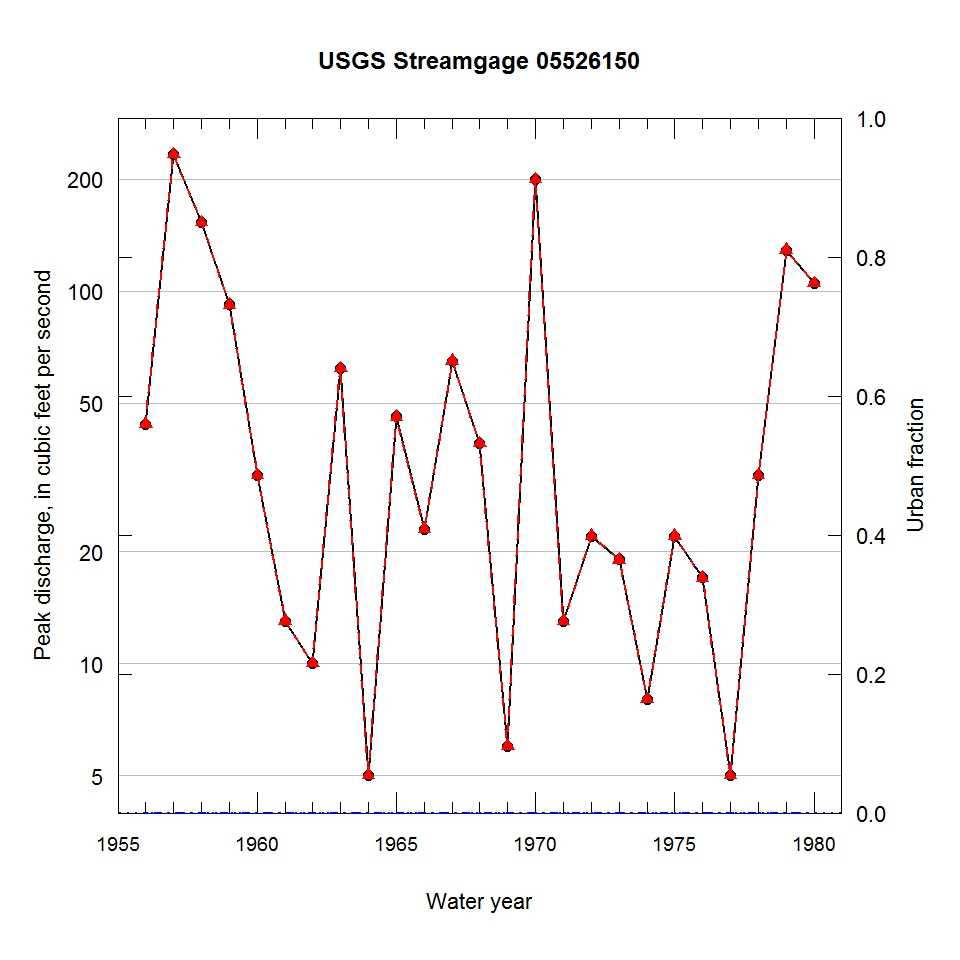
Observed and urbanization-adjusted annual maximum peak discharge and associated urban fraction and precipitation values at USGS streamgage:
05526150 KANKAKEE RIVER TRIBUTARY NEAR BOURBONNAIS, IL


| Water year | Segment | Discharge code | Cumulative reservoir storage (acre-feet) | Urban fraction | Precipitation (inches) | Observed peak discharge (ft3/s) | Adjusted peak discharge (ft3/s) | Exceedance probability |
| 1956 | 1 | -- | 0 | 0.000 | 0.438 | 44 | 44 | 0.334 |
| 1957 | 1 | -- | 0 | 0.000 | 3.656 | 233 | 233 | 0.002 |
| 1958 | 1 | -- | 0 | 0.000 | 1.202 | 153 | 153 | 0.011 |
| 1959 | 1 | -- | 0 | 0.000 | 1.278 | 92 | 92 | 0.047 |
| 1960 | 1 | -- | 0 | 0.000 | 0.959 | 32 | 32 | 0.552 |
| 1961 | 1 | -- | 0 | 0.000 | 1.817 | 13 | 13 | 0.909 |
| 1962 | 1 | -- | 0 | 0.000 | 0.291 | 10 | 10 | 0.943 |
| 1963 | 1 | -- | 0 | 0.000 | 0.560 | 62 | 62 | 0.151 |
| 1964 | 1 | -- | 0 | 0.000 | 1.044 | 5 | 5 | 0.985 |
| 1965 | 1 | -- | 0 | 0.000 | 0.981 | 46 | 46 | 0.307 |
| 1966 | 1 | -- | 0 | 0.000 | 1.489 | 23 | 23 | 0.742 |
| 1967 | 1 | -- | 0 | 0.000 | 0.720 | 65 | 65 | 0.131 |
| 1968 | 1 | -- | 0 | 0.000 | 2.147 | 39 | 39 | 0.409 |
| 1969 | 1 | -- | 0 | 0.000 | 1.246 | 6 | 6 | 0.979 |
| 1970 | 1 | -- | 0 | 0.000 | 1.882 | 200 | 200 | 0.005 |
| 1971 | 1 | -- | 0 | 0.000 | 0.293 | 13 | 13 | 0.909 |
| 1972 | 1 | -- | 0 | 0.000 | 0.893 | 22 | 22 | 0.761 |
| 1973 | 1 | -- | 0 | 0.000 | 1.594 | 19 | 19 | 0.815 |
| 1974 | 1 | -- | 0 | 0.000 | 0.650 | 8 | 8 | 0.960 |
| 1975 | 1 | -- | 0 | 0.000 | 0.569 | 22 | 22 | 0.761 |
| 1976 | 1 | -- | 0 | 0.000 | 0.720 | 17 | 17 | 0.849 |
| 1977 | 1 | 4 | 0 | 0.000 | 0.303 | 5 | 5 | 0.985 |
| 1978 | 1 | -- | 0 | 0.000 | 0.845 | 32 | 32 | 0.552 |
| 1979 | 1 | -- | 0 | 0.000 | 0.329 | 129 | 129 | 0.017 |
| 1980 | 1 | -- | 0 | 0.000 | 1.421 | 105 | 105 | 0.031 |

